Case Study 07
S&P 500 Fundamentals Analytics
Cross-sector valuation & volatility study
The Problem
Company fundamentals like EPS, P/E, and P/B are widely used for valuation, but their relationships to each other and to sector context aren't always intuitive. This project set out to quantify those relationships across the full S&P 500 rather than rely on rules of thumb.
Approach
- 01Collected and cleaned fundamentals data (EPS, P/E, P/B, dividends, volatility) across S&P 500 constituents.
- 02Ran correlation analysis between valuation metrics — including EPS vs. market cap and P/E vs. EPS — to surface which relationships actually hold across the index.
- 03Broke results down by sector to see how valuation relationships shift across industries, rather than treating the S&P 500 as one homogeneous group.
- 04Visualized findings with Matplotlib scatter and correlation plots for interpretability.
Visuals
Results
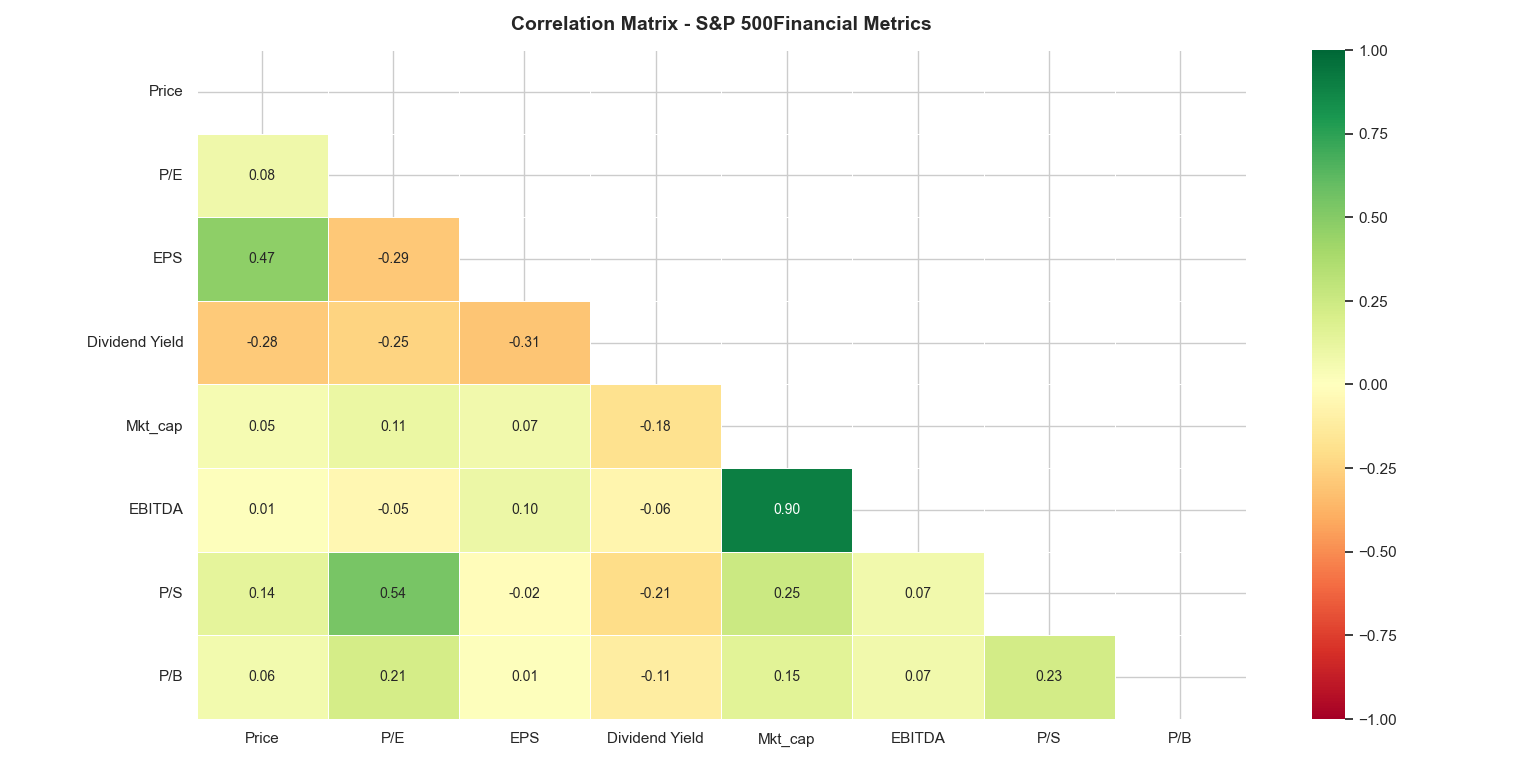
Market Cap and EBITDA are the strongest pair in the matrix at 0.90 correlation — largely mechanical, since EBITDA drives valuation.
EPS correlates with Price at 0.47 but only 0.08 with P/E — a stock's earnings power says almost nothing about how expensive it is relative to peers.
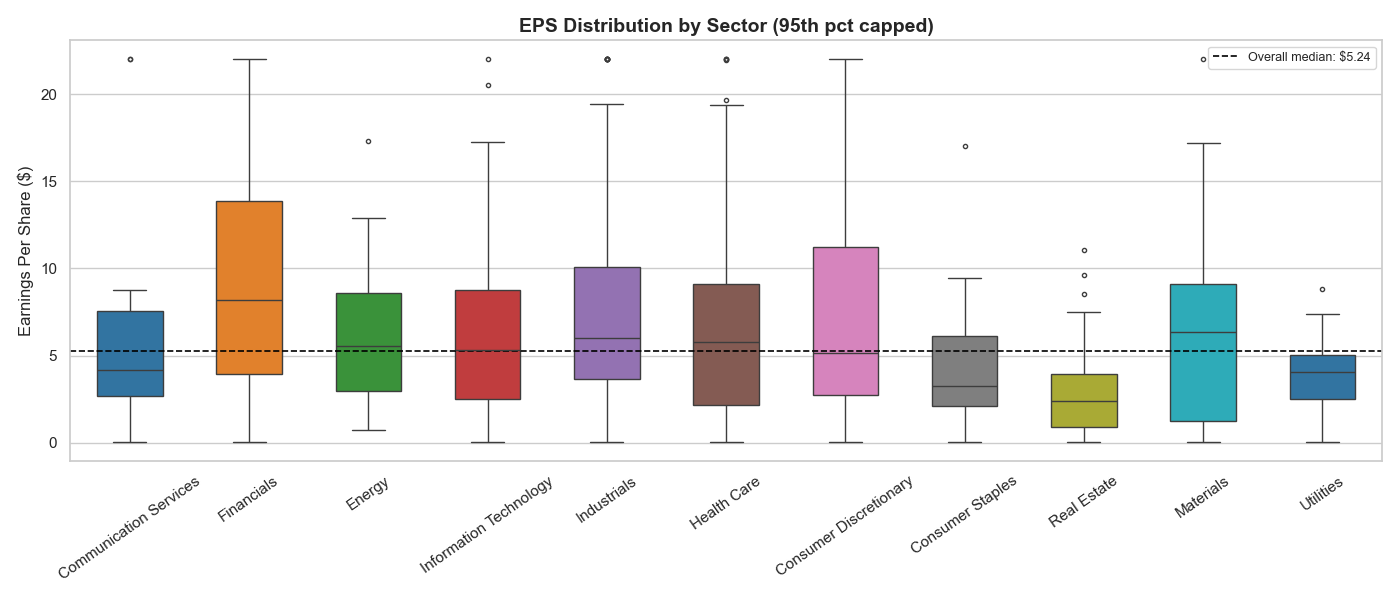
Financials had both the highest median EPS and the widest spread across companies; Real Estate the lowest and most compressed.
Overall median EPS across the index sits at $5.24, with big dispersion by sector rather than a single 'typical' company.
Reflection
This project was a reminder that treating an index like the S&P 500 as one uniform group hides a lot of signal — the same valuation relationship can look completely different once you slice by sector.