Data Analyst · Aspiring Data Scientist · ML & Research

Raj Kamal Singh

Data Analyst by trade, Data Scientist by ambition — turning messy data into decisions and deployable ML systems.

4+ years building data-driven systems in industry, now pursuing an M.S. in Data Science at the University of Maryland. Open to roles in Data Science, Data Analytics, Data Engineering, and Applied Research.

Raj Kamal Singh

Skills

01Skills

Programming & ML

  • Python, SQL, C++
  • PyTorch, TensorFlow, Scikit-Learn
  • LSTM, GANs, A/B Testing
  • Hypothesis Testing, Statistical Modeling

Data & BI

  • Pandas, NumPy
  • Power BI, Tableau, DAX
  • EDA, ETL Pipelines
  • Regression & Classification

Cloud & Tools

  • AWS (S3, EC2, Athena, QuickSight)
  • AWS Kinesis, Lambda
  • Snowflake, Databricks
  • Docker, Git
02Selected Projects

Projects

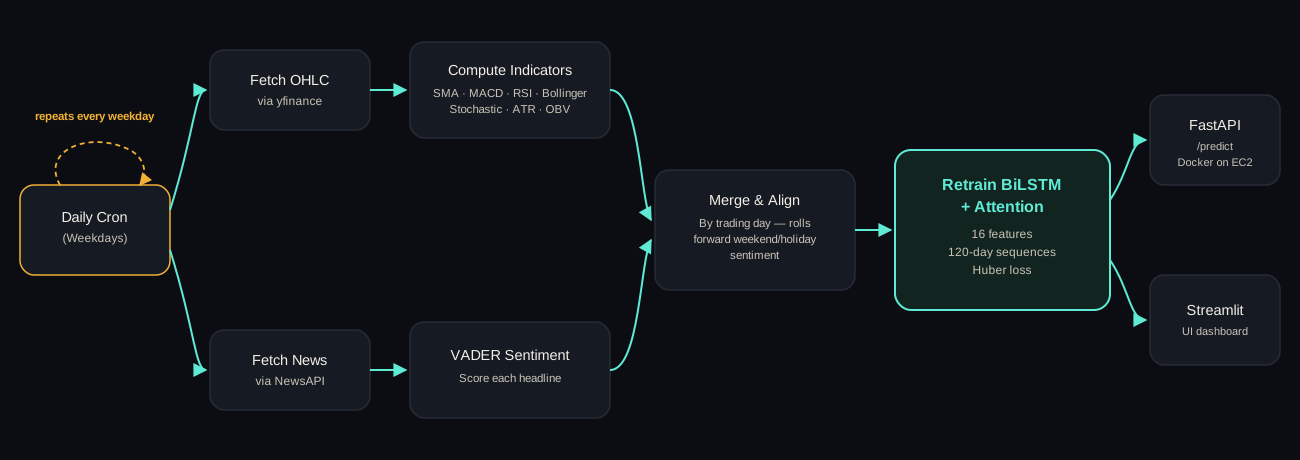
Architecture diagram showing two parallel daily pipelines — fetching OHLC data and computing technical indicators, and fetching news and scoring sentiment with VADER — merging by trading day, feeding a Bidirectional LSTM with attention, served through both a FastAPI endpoint and a Streamlit dashboard, all triggered by a daily cron job

Stock Price Prediction Using LSTM

01

Bidirectional LSTM + attention, retrained daily on fresh data

A self-updating forecasting pipeline: a daily cron job pulls fresh OHLC prices and news headlines, scores sentiment, and retrains a Bidirectional LSTM with attention on the combined feature set — served through both a FastAPI endpoint and a Streamlit dashboard.

15% improvement in prediction accuracy over baseline models.

PythonTensorFlowFastAPIStreamlitDockerAWS EC2
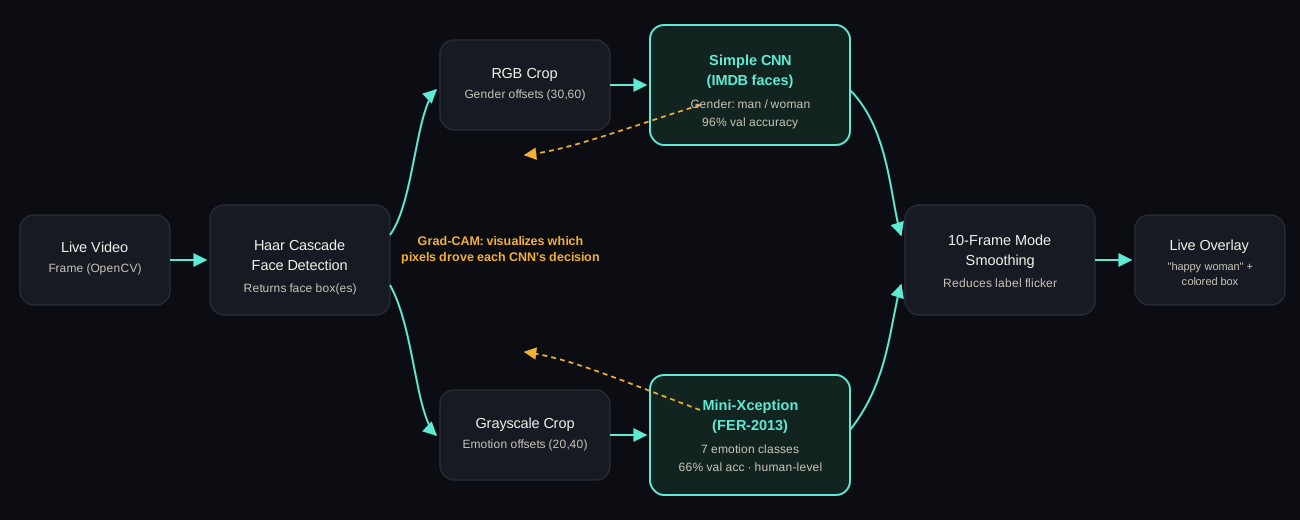
Architecture diagram showing a live video frame going through Haar Cascade face detection, then splitting into two parallel branches — an RGB crop feeding a Simple CNN for gender classification at 96% accuracy, and a grayscale crop feeding a Mini-Xception model for emotion classification at 66% accuracy — both converging into 10-frame mode smoothing and a live overlay output, with Grad-CAM shown as an interpretability layer on both classifiers

Real-Time Face Detection, Gender & Emotion Classification

02

Two parallel CNNs with Grad-CAM interpretability

A real-time vision pipeline that detects faces via Haar Cascades, then runs two separate CNNs in parallel — one classifying gender (IMDB faces, 96% accuracy), one classifying emotion (FER-2013, 66% accuracy, matching human-level performance) — with temporal smoothing to stabilize labels and Grad-CAM visualization to interpret what each model actually learned.

96% validation accuracy on gender classification (simple CNN, IMDB faces).

PythonKerasOpenCVGrad-CAM
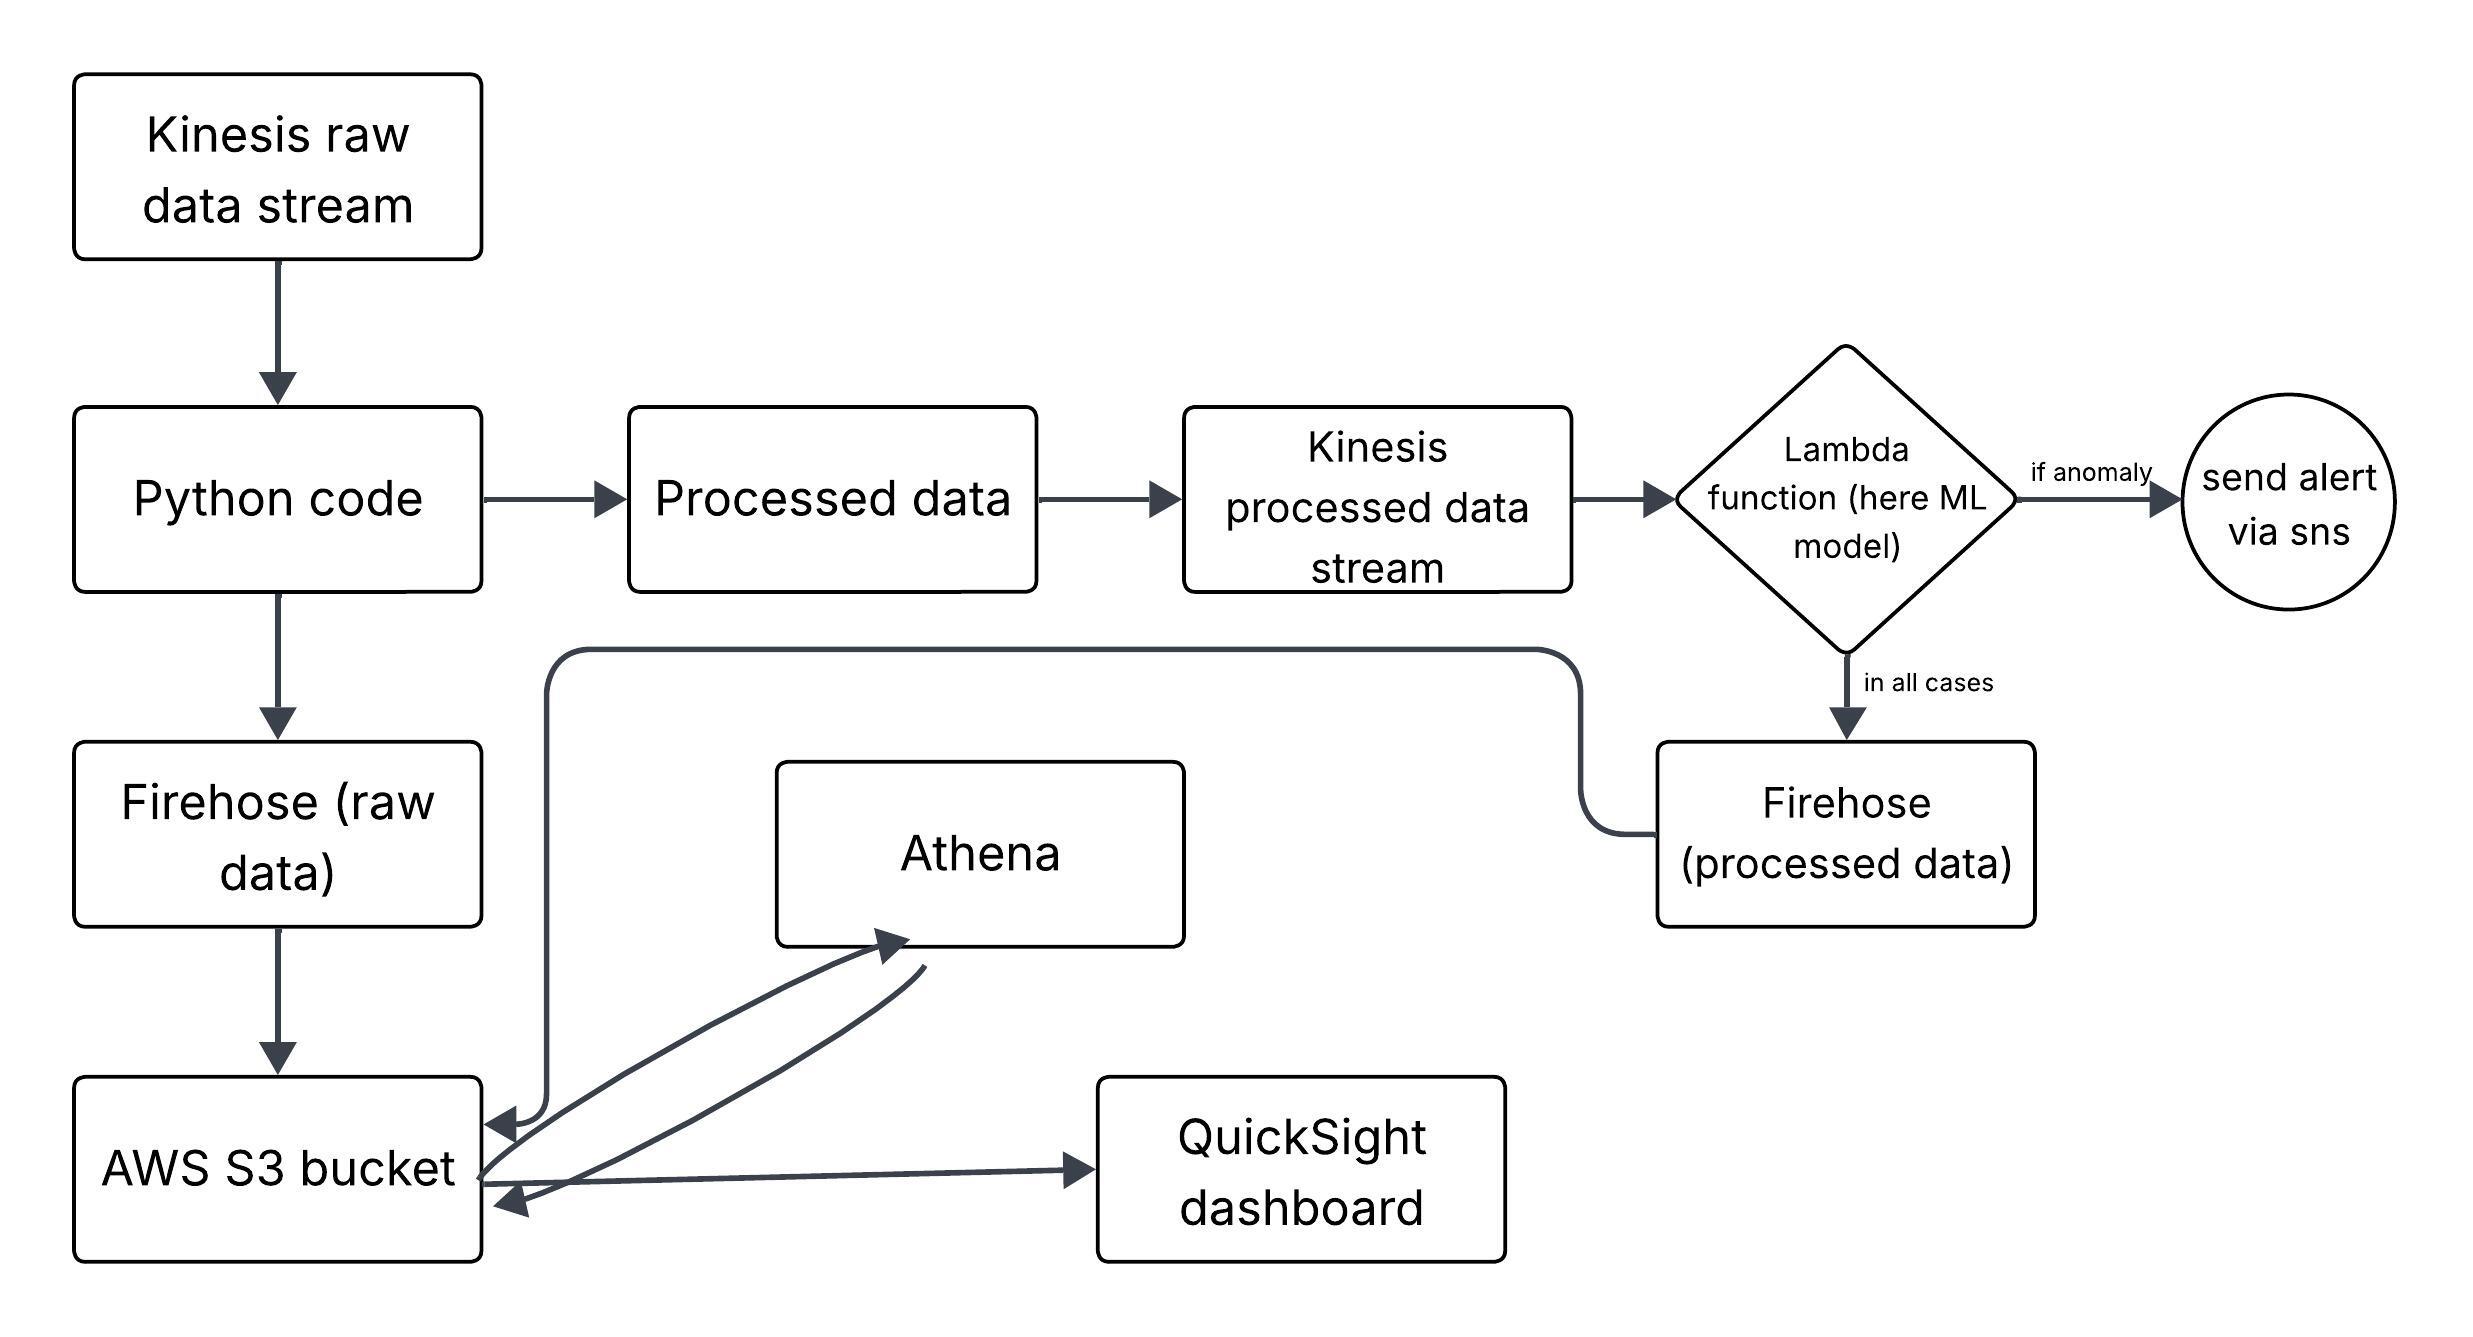
Architecture diagram of the Bitcoin anomaly detection pipeline: Kinesis raw data stream into Python processing, a processed Kinesis stream, a Lambda function running the ML model that sends SNS alerts on anomalies, and parallel Firehose deliveries into S3, Athena, and a QuickSight dashboard

Real-Time Bitcoin Anomaly Detection

03

Kinesis + Lambda pipeline with SNS alerting

A real-time streaming pipeline on AWS — Kinesis ingests raw data, a Lambda function scores each record with an Isolation Forest model and fires SNS alerts on anomalies, while parallel Firehose deliveries feed S3, Athena, and a QuickSight dashboard for live and historical analysis.

Processed 10K+ records/day with sub-second anomaly detection latency.

AWS KinesisLambdaIsolation ForestFirehoseAthenaQuickSight

RAG-Based QA System

04

Fine-tuned FLAN-T5 at 4,000× data scale

Scaled a generative question-answering pipeline from a 20-example custom FAQ dataset to 87K+ SQuAD-style examples, fine-tuning FLAN-T5 with Hugging Face Transformers using mixed-precision training, and deploying an interactive Gradio inference app.

Scaled training data 4,000× — from 20 examples to 87K+.

PythonHugging FaceFLAN-T5Gradio
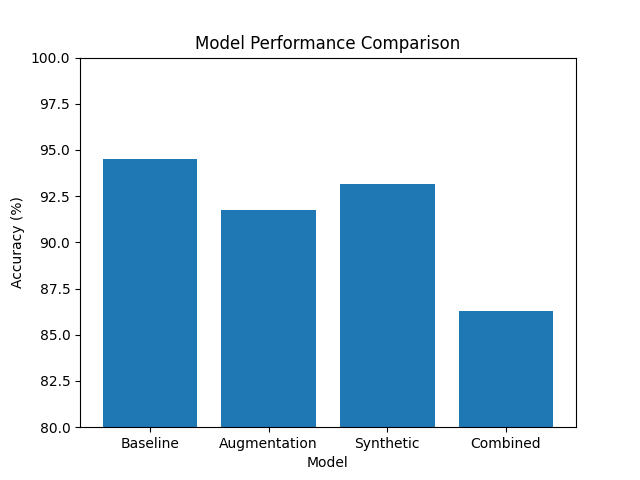
Bar chart comparing test accuracy across four training strategies: Baseline at 94.5%, Augmentation at 91.7%, Synthetic at 93.1%, and Combined at 86.3%

Food Context Classification via Transfer Learning

05

ResNet-50 · home vs. restaurant vs. packaged food

Studied how a pretrained ResNet-50 classifies food images by scene context — home, restaurant, or packaged — rather than by the food itself, then compared four training strategies (baseline, augmentation, synthetic noise, and combined) to see which actually helped.

94.5% test accuracy with the plain baseline transfer-learning model — the best of the four.

PyTorchResNet-50Transfer Learning
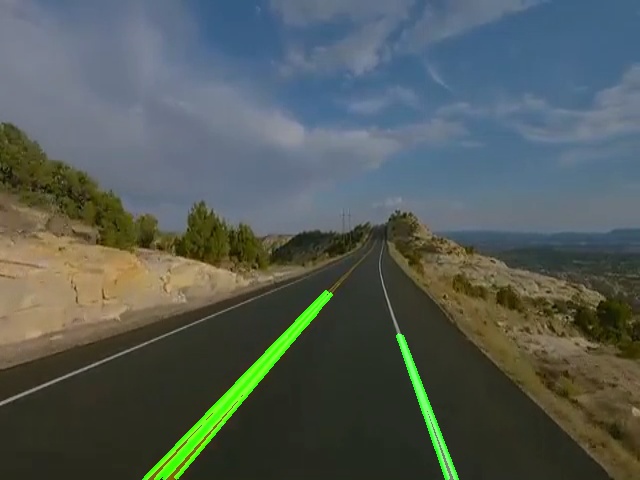
Mountain road with detected lane lines overlaid in bright green, extending from the bottom of the frame toward the vanishing point

Real-World Lane Detection

06

Classical computer vision under adverse conditions

Built a classical edge-based lane detection pipeline (Canny + Hough transform) and stress-tested it against shadows, motion blur, and bright light, then improved robustness with adaptive thresholds, histogram equalization, and slope filtering.

Adaptive-threshold pipeline reduced false lane detections compared to the fixed-threshold baseline.

PythonOpenCVCanny/Hough
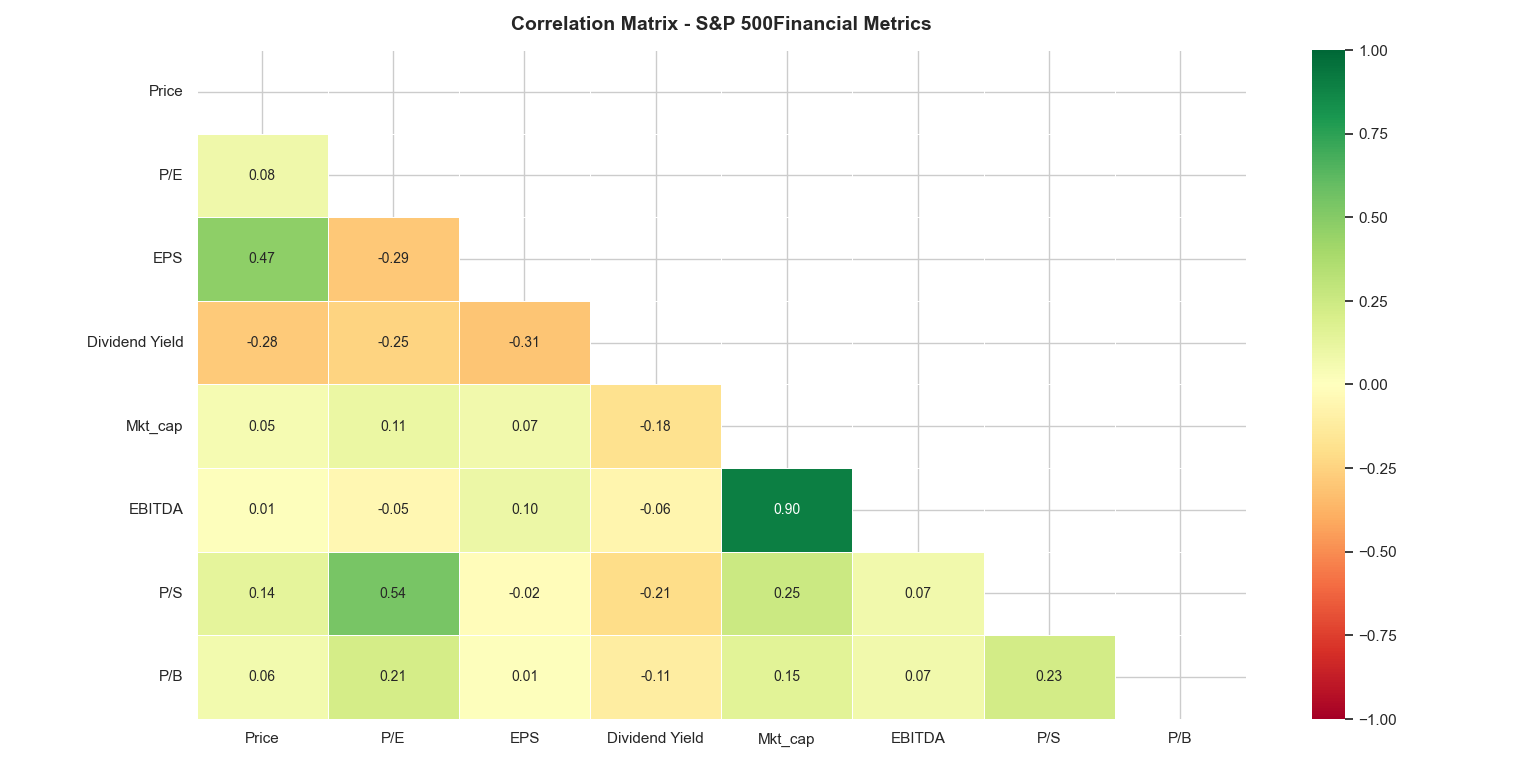
Correlation matrix heatmap of S&P 500 financial metrics including Price, P/E, EPS, Dividend Yield, Market Cap, EBITDA, P/S, and P/B

S&P 500 Fundamentals Analytics

07

Cross-sector valuation & volatility study

A statistical analysis of S&P 500 company fundamentals — EPS, P/E, P/B, dividends, and volatility — exploring correlations between valuation metrics and how they vary across sectors.

Market Cap and EBITDA are the strongest pair in the matrix at 0.90 correlation — largely mechanical, since EBITDA drives valuation.

PythonPandasMatplotlib
About

03About

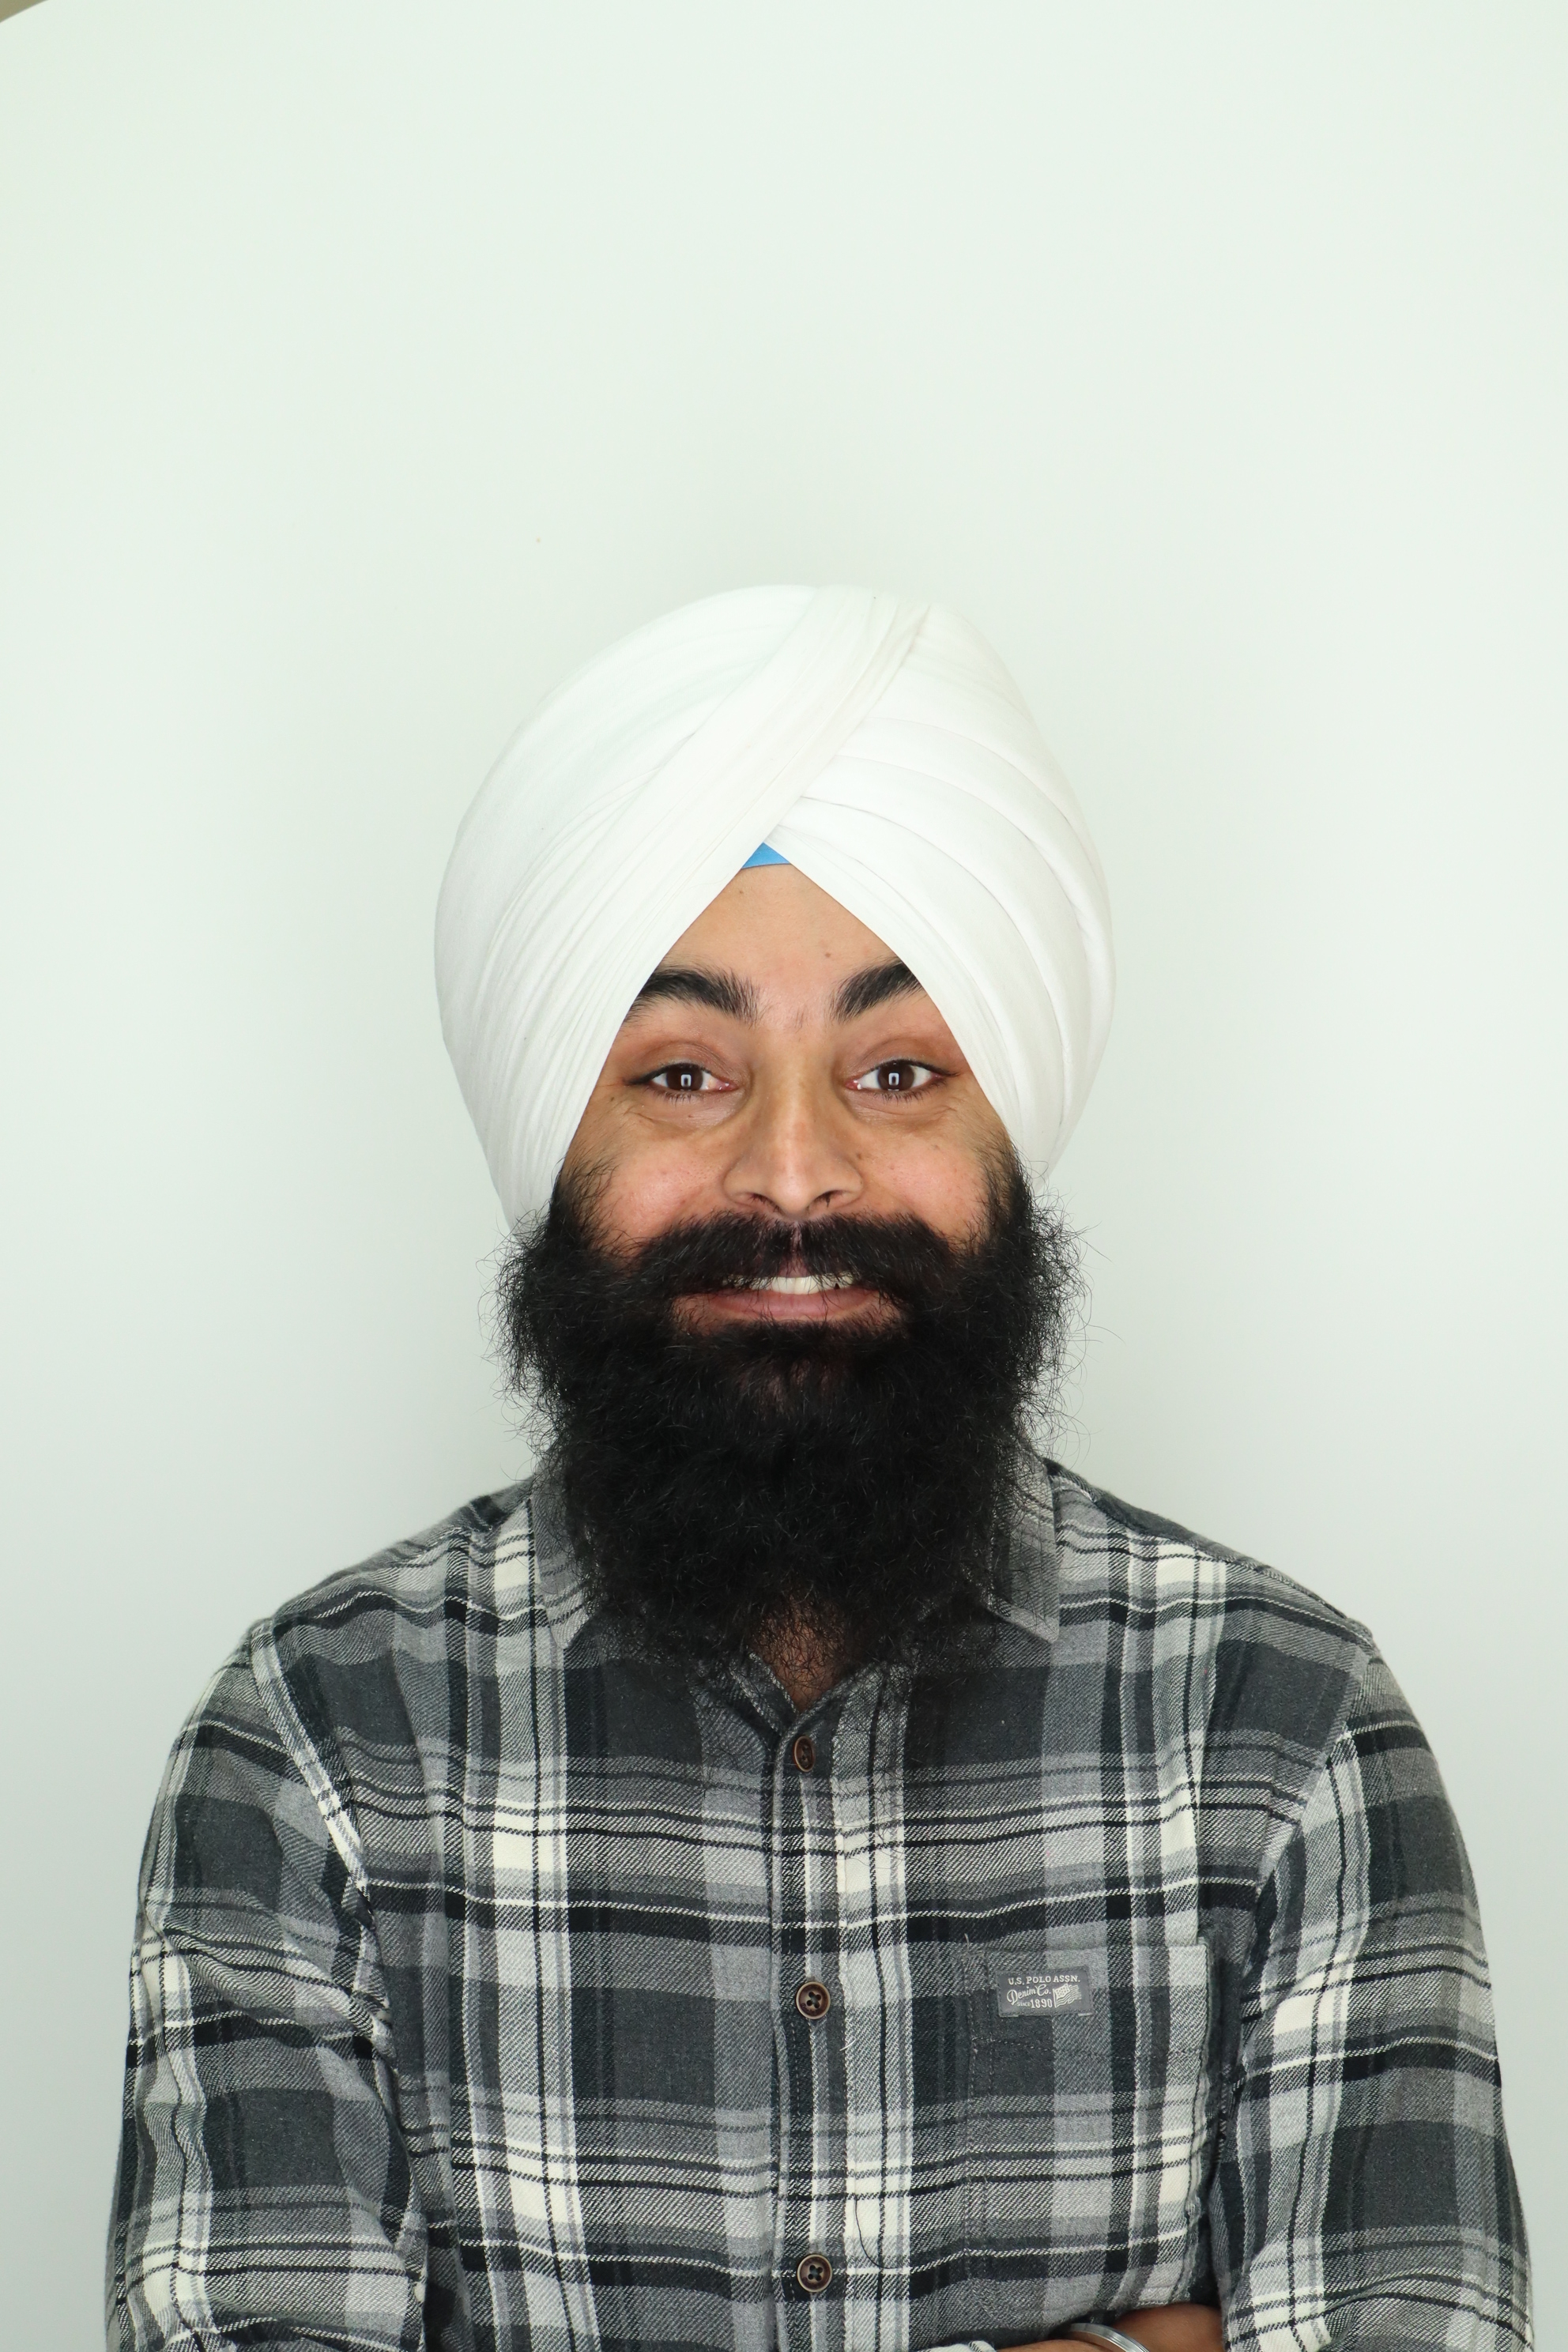
I'm a Data Analyst with 4+ years of professional experience turning large-scale operational and financial datasets into decisions — currently at Fidelity Investments, previously at Nimbbl and LTI. I'm pursuing an M.S. in Data Science at the University of Maryland (GPA 3.86, expected May 2026) to move deeper into machine learning, and I'm actively looking for my next role across Data Science, Data Analytics, Data Engineering, and Applied Research.

My project work spans the full ML lifecycle — time-series forecasting with LSTMs, NLP systems built on fine-tuned transformer models, and real-time anomaly detection on streaming infrastructure — from data preprocessing and feature engineering through deployment and monitoring.

I also have research experience and a published paper at IEEE ISMSIT, reflecting my interest in rigorous experimentation. Beyond the numbers, I care about translating data into insights that actually change decisions.

7+

ML & data projects shipped

1

Published IEEE research paper

4+ yrs

Professional data analytics experience

Education

04Education

M.S. in Data Science

University of Maryland, College Park

GPA 3.86 / 4.0 · Expected May 2026

B.Tech in Computer Science & Engineering

University of Petroleum and Energy Studies

CGPA 7.92 / 10 (~3.5 / 4.0) · June 2020

Research & Publications

05Research & Publications

GAN & IEC Approach for Image Generation

IEEE ISMSIT 2022

Developed a GAN model coupled with Improved Evolutionary Computing (IEC) to generate high-quality synthetic images, achieving a 94% realism rating and reducing model collapse by 20% through improved training strategies.

View publication (ORCID) (opens in new tab)

Professional Experience

06Professional Experience

Data Analyst

Fidelity Investments

May 2025 – Present

  • Built Python and SQL analytical workflows to validate large-scale financial datasets, improving reporting accuracy by 25% and cutting manual analysis effort by 40%.
  • Built automated data-quality monitoring pipelines using Python and Pandas, reducing data inconsistencies by 30%.
  • Designed interactive dashboards and KPI reporting using AWS Athena and QuickSight, cutting stakeholder reporting turnaround time by 50%.
  • Partnered with data engineering to optimize ETL workflows, reducing data retrieval latency by 35%.

Data Analyst

Nimbbl

July 2022 – July 2024

  • Analyzed high-volume production datasets and application logs using SQL and Python, identifying failure patterns that contributed to a 30% reduction in production defects.
  • Performed root-cause analysis, statistical validation, and hypothesis testing to evaluate system enhancements.
  • Built automated validation frameworks and data-quality checks, cutting manual verification effort by 45%.

Quality Analyst

LTI

June 2020 – June 2022

  • Developed data-driven validation frameworks across 2,000+ test scenarios, contributing to a 25% reduction in post-release defects.
  • Automated test data preparation and validation workflows using SQL and Python, cutting repetitive manual effort by 35%.
  • Produced testing metrics and release-readiness analyses supporting 97% on-time delivery across client engagements.

Get in touch

Let’s connect.

I’m open to roles across data science, analytics, engineering, and research. The best way to reach me is via email or LinkedIn.

+1 (240) 861-1109